Students Reached in 2024–25
Educators on Teams in 2024–25
$ Total Extra Pay as of 2024–25
Extra Months of Learning Each Year
% Consistent Teacher-Leader Approval
$ Average Team Leader Stipend
In the first 12 years of Opportunity Culture® school redesign, 90 sites in 18 U.S. states* changed roles, teams, pay, budgets, and schedules to reach more students with excellent teaching and more educators with excellent careers.
sites
The sites include rural and urban school districts and charter school networks, ranging from systems with just a few schools to the nation’s third-largest school district.
*state count includes the District of Columbia

At the end of 2024–25, more than 1,000 schools were implementing or planning Opportunity Culture® designs, or committed by their districts or states to use them in coming years. More than 90% of schools using the designs are eligible for Title I funding.
schools
At the end of 2023–24, Public Impact® introduced certification levels, based on 12+ years of data and research in key areas that include selectivity of Opportunity Culture® roles, student access to instruction led by Opportunity Culture® teams, incorporation of small-group, high-dosage tutoring into schedules, and financial sustainability of roles and pay. See a list of schools with certification here.

Over 255,000 students were being reached by one or more Opportunity Culture® teachers in 2024–25 alone.
students
Opportunity Culture® teachers reach students across all four core subjects, which may now include CTE courses. Students may be reached in more than one subject; the count of “over 255,000” represents unduplicated student numbers.
MATH
READING
SOCIAL STUDIES
SCIENCE

Schools see up to 3X rate of schoolwide high learning growth with Opportunity Culture® designs. Students gain an extra 2–7 months of learning each year.†
growth
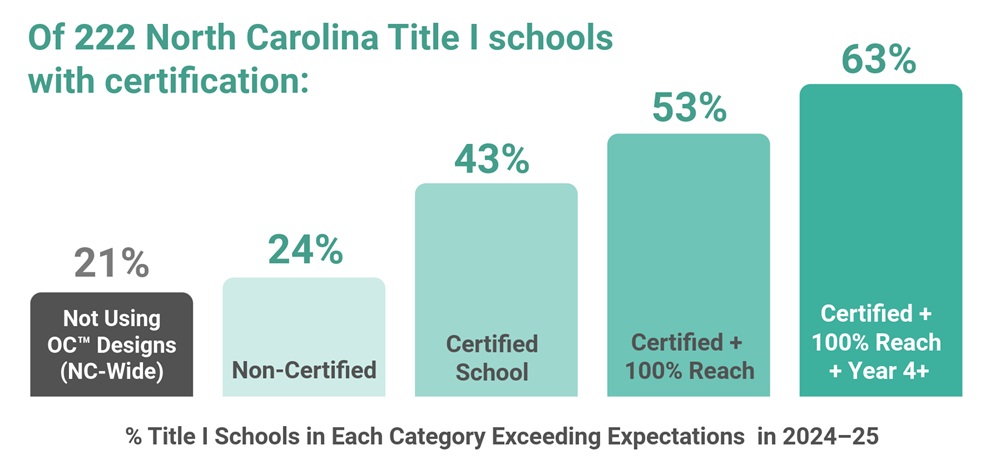
North Carolina schools with Certified Opportunity Culture School® status were two to three times more likely to exceed learning growth expectations schoolwide than schools not using Opportunity Culture® staffing designs, 2024–25 data from the North Carolina Department of Public Instruction shows. Read more third-party research here.

- Of all 258 schools with certification, 48% exceeded growth targets, compared with 25% of all schools in the state without these staffing designs.
- Of the 222 Title I schools with certification, 43% exceeded growth targets, compared with 21% of Title I schools in the state without these designs.
The certified schools were also significantly less likely to fall short of growth expectations than comparable schools.

As of 2024–25, over 9,800 educators are in advanced, higher-paid Opportunity Culture® roles or are receiving on-the-job development on teaching teams.
EDUCATORS
Before 2017–18, schools planning Opportunity Culture® designs used a variety of roles to extend teachers’ reach. All schools implementing since 2018 use Multi-Classroom Leader® roles, with a variety of team structures and roles on their teams.
MCL™ Role
TRT™/MTRT™ Roles
RA™ Role
Team Teacher

From the initiative launch in 2013 through 2024–25, more than $107 million have been reallocated to higher educator pay, including $28 million in 2024–25 alone.
pay
In 2024–25, the average Multi-Classroom Leader® supplement was 20% of average pay.
$ Maximum OC™ Supplement
$ Average MCL™ Supplement

97–99% of educators in the Multi-Classroom Leader® role and more than 90% of educators in all Opportunity Culture® roles want the roles to continue in their schools.
survey
Educators express strong satisfaction with their roles
97–99% of educators in the Multi-Classroom Leader® role consistently report wanting these roles to continue in their schools, according to a decade of anonymous survey results.
Over multiple years, more than 90% of educators in the MCL™ role have agreed that:
- Teachers in my school have opportunities to lead peers 90+%
- The supports provided translate into improved instructional practice 90+%
- Teachers receive feedback that can help them improve teaching 90+%
- Teachers are held to high professional standards for delivering instruction 90+%
†Growth notes:
In third-party studies, in reading and math among students directly taught by MCL™ roles or their team teachers, students gained an extra 2–7 months of learning above comparable students each year, or an average of +4.5 extra months in a nine-month school year (extra half year, on average). Schoolwide growth effects cited above are important, too, because MCL™ teams have reported in video documentation during each school year that they share methods and materials outside of their teams.
