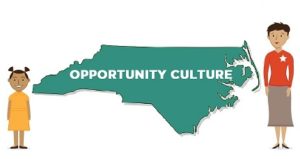
Fifty-nine percent of Opportunity Culture® schools in North Carolina exceeded student growth expectations in 2015–16, more than double the percentage of N.C. schools overall at just 28 percent, according to school performance data the state released September 2.
Similarly, high-poverty Opportunity Culture® schools exceeded growth expectations at much higher rates than in North Carolina overall: 56 percent versus 26 percent of high-poverty schools statewide. High-poverty schools have 40 percent or more students qualifying for free or reduced lunch.
Two-thirds of Opportunity Culture® schools were high-poverty schools.
Statewide, 25 percent of N.C. schools overall did not meet growth expectations, compared with 11 percent of Opportunity Culture® schools in the state.
Opportunity Culture® schools redesign teacher and teacher-leader roles to extend great teachers’ reach and provide all students with access to excellent teaching, consistently. More teachers experience teacher-led, on-the-job learning and paid career opportunities, all funded within regular school budgets.
Both the Charlotte-Mecklenburg (CMS) and Cabarrus County districts have Opportunity Culture® schools.
In CMS, 51 percent of non-Opportunity Culture® schools exceeded growth expectations. But CMS Opportunity Culture® schools were even more likely to surpass expectations, with 62 percent exceeding expectations.
Among high-poverty schools in CMS, 57 percent of Opportunity Culture® schools exceeded expectations, compared with 44 percent of non-Opportunity Culture® schools.
High-poverty Opportunity Culture® schools that exceeded expectations reached nearly 70 percent of their students with teachers in Opportunity Culture® roles reserved for highly effective teachers. Low-poverty Opportunity Culture® schools that exceeded growth expectations were more likely than high-poverty schools to use Opportunity Culture® roles only in selected grades or subjects. Most of the low-poverty Opportunity Culture® schools exceeding expectations had twice the state’s average percentage of highly effective teachers in 2014–15; they used these roles selectively to reach even more students with great teaching.
Public Impact® will release additional data about Opportunity Culture® sites nationally, including teacher satisfaction surveys and the growing number of students affected, later in 2016. Public Impact® also will be conducting additional analyses to understand the differences between Opportunity Culture® schools exceeding growth expectations and other schools. This will include identifying how successful schools chose where to target Opportunity Culture® roles when using them in only part of a school. This analysis may have implications for school turnarounds, closing achievement gaps in lower-poverty schools, and student success in grades and subjects not reflected in the EVAAS ratings.
Data currently available are based on limited numbers of schools. As more schools implement Opportunity Culture® models, Public Impact® will have increasingly accurate information about which Opportunity Culture® models and implementation methods work best in differing circumstances.
Note: Public Impact® and Opportunity Culture® are registered trademarks.
